Each section names the problem, the idea in one line, what you will be able to do, and the method from the book.
1. The P&L, line by line
The problem: The numbers come up in a meeting and you nod along.
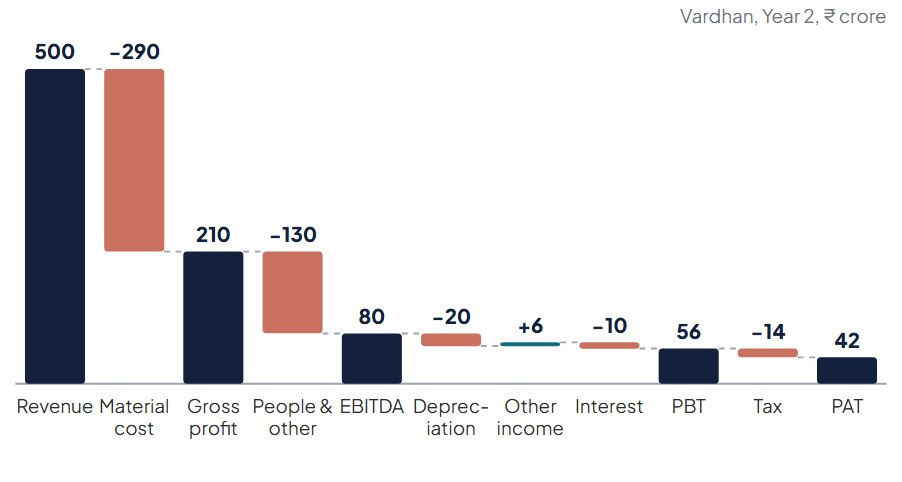
The profit and loss statement walks from what customers paid to what the owners keep, and every step on the way tells you something.
By the end of the chapter you can:
- Read any Indian P&L from top to bottom
- Work out gross, operating and net margins in a minute
- Spot the lines that need a question
The profit ladder
Read the P&L as a ladder. Each rung removes one kind of cost and tells you something different about the business.
| Rung | Tells you |
|---|---|
| Gross profit | Is the product priced well above what it costs to make? |
| EBITDA | Is the business itself profitable, before machines, loans and tax? |
| PBT (profit before tax) | What is left after paying for assets and lenders? |
| PAT (profit after tax) | What belongs to the owners for the year? |
2. Growth and margins
The problem: You have a page of figures and don't know which ones matter.
Growth tells you whether the business is getting bigger; margins tell you whether it is getting better.
By the end of the chapter you can:
- Work out growth rates, including CAGR
- Separate growth from volume and from price
- Read margin trends and explain them
Volume, price and mix
Revenue can grow because the company sold more units, raised prices, or sold more expensive products. Each means something different about the business. Annual reports and investor presentations often give the volume figures you need.
| Source of growth | What it tells you | How long it lasts |
|---|---|---|
| Volume (more units) | Real demand; market share or new customers | Long, if capacity and demand allow |
| Price (same product, higher price) | Pricing power, or passing on cost inflation | Limited by competitors and customers |
| Mix (more premium products) | Customers trading up; better products | Long, if the brand supports it |
| Acquisitions | Bought, not grown | One-off; check the next year |
3. Operating cash vs profit
The problem: Profits look good, but the cash never seems to arrive.
The bridge from profit to operating cash shows exactly where profit is waiting, or missing.
By the end of the chapter you can:
- Build a profit-to-cash bridge from any cash flow statement
- Spot operating cash that has been flattered
- See how a cash gap is being funded
Ways operating cash can be flattered
Operating cash is harder to manipulate than profit, but not impossible. These moves make it look better without the business improving. Each is legal and can be sensible; the question is whether it is repeated or disclosed.
| Move | What it does | Where to look |
|---|---|---|
| Selling or discounting receivables just before year-end | Turns dues into cash early | Notes on receivables and factoring |
| Stretching supplier payments at year-end | Keeps cash in the bank on 31 March | Payable days; dues to micro and small suppliers |
| Supplier finance arrangements | A bank pays the supplier; the company owes the bank later, shown as a payable | Notes on payables and borrowings |
| Classifying items into investing or financing | Moves outflows out of operating cash | Policy note; compare with peers |
| Cutting essential spending | Defers maintenance, advertising or training | Cost lines against history |
Payables that rise much faster than purchases deserve the same check, from the other side.
4. Lay it out
The problem: Your forecast is one big guess typed into a single cell.
A clear layout is the difference between a model people trust and one only its author can use.
By the end of the chapter you can:
- Lay out any model in four clear zones
- Write formulas that are consistent across time
- Use colour and format so readers know what they can change
Time across, one formula per row
Put labels in column A, units in column B, the last actual year in column C and forecast years to the right. Then follow one rule above all: every cell in a forecast row uses the same formula.
| Rule | Why |
|---|---|
| No typed numbers in formulas | =D3*(1+E2), never =D3*1.12; the 12% lives in an input cell |
| Same formula across the row | Copy right; errors can't hide in one year |
| Units column | ₹ crore, %, days, units: no guessing |
| Actuals typed, forecasts calculated | Column C is history; D onwards is the model |
Exceptions belong in their own rows. If Year 3 has a one-off cost, add a row for it rather than editing one cell of the cost formula.
5. Enterprise value and equity value
The problem: Someone has put a value on a business and you must judge it.
Enterprise value is the price of the whole business; equity value is what is left for shareholders after everyone else with a claim is paid.
By the end of the chapter you can:
- Move between enterprise and equity value in both directions
- Decide which items belong in the bridge
- Avoid counting cash or debt twice
The bridge, line by line
| Item | Add or subtract | Why |
|---|---|---|
| Borrowings (short and long term) | Subtract | Lenders are paid before shareholders |
| Lease liabilities | Subtract, if EBITDA excludes rent | Debt-like claims; be consistent with EBITDA |
| Cash and liquid investments | Add | Not needed to run the business |
| Non-operating investments and surplus property | Add | Their value isn't in operating cash flow |
| Minority (non-controlling) interests | Subtract | Part of subsidiaries belongs to others |
| Associates and joint ventures | Add their value | Their profits aren't in consolidated EBITDA |
| Preference shares, convertible debt | Subtract | Claims ahead of ordinary shares |
| Unfunded employee benefits, big provisions | Subtract, if material | Cash that will leave |
| Disputed tax demands likely to be paid | Subtract an estimate | Probable claims |
6. Build from drivers
The problem: Your budget is out of date by June.
A budget built from the things managers control can be discussed, owned and checked; a percentage can't.
By the end of the chapter you can:
- Choose drivers for revenue and costs
- Build and phase a budget from them
- Give every driver an owner and a reason
Choosing budget drivers
| Line | Good drivers | Owner |
|---|---|---|
| Revenue | Units, price, channel mix, dealers, stores, customers | Sales and marketing heads |
| Material cost | Units × material per unit × input prices | Purchase and plant heads |
| Employee cost | Headcount by grade × cost per person; pay-rise month | HR and department heads |
| Freight | Tonnes or orders × rate | Logistics |
| Advertising | Campaign plan; % of revenue as a cap | Marketing |
| Power | Units produced × kWh per unit × tariff | Plant head |
| Working capital | Receivable, inventory and payable days | Sales, plant, purchase |
Agree each driver's definition once, for example whether “units” means dispatched or invoiced, and use it in the budget, the forecast and the monthly pack alike.
7. Contribution and break-even
The problem: Some products or customers look profitable but may not be.
Every sale contributes something towards fixed costs; once they are covered, contribution becomes profit.
By the end of the chapter you can:
- Work out contribution margin and break-even
- Measure the margin of safety and operating leverage
- Find the sales needed for a target profit
Break-even and margin of safety
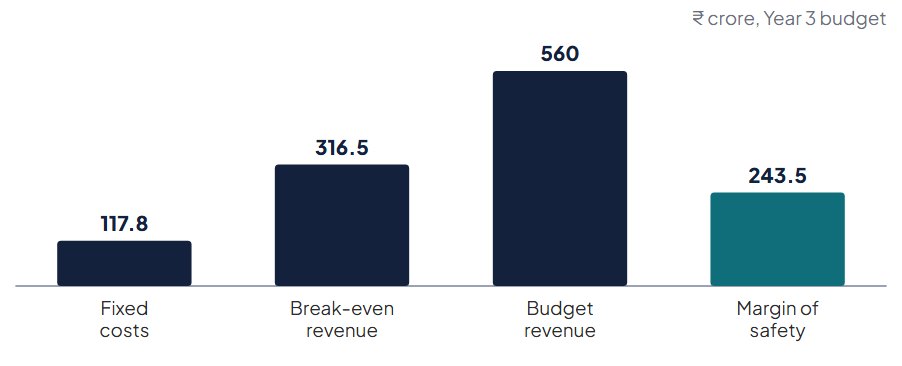
The break-even point is the sales level at which contribution exactly covers fixed costs: no profit, no loss. The margin of safety is how far sales can fall before reaching it.
| Vardhan, Year 3 | Value |
|---|---|
| Fixed costs | ₹117.8 crore |
| Contribution margin | 37.2% |
| Break-even revenue | ₹316.5 crore |
| Budgeted revenue | ₹560.0 crore |
| Margin of safety | ₹243.5 crore, or 43.5% of revenue |
8. Receivables
The problem: The company is profitable but keeps running short of cash.
Credit is a sales tool with a price; set it deliberately, collect it systematically, and fund it cheaply.
By the end of the chapter you can:
- Set credit terms and limits
- Run a weekly collections routine
- Choose between discounts, factoring and dealer finance
Reading the ageing
The ageing table sorts what customers owe by how long it has been due. It is the single most useful receivables report: it shows where cash is stuck and where losses may come.
| Vardhan, end of Year 2 (₹ crore) | Amount | Share | Action |
|---|---|---|---|
| Not yet due | 52.0 | 65% | Routine |
| 1–30 days overdue | 13.0 | 16% | Reminder and call |
| 31–90 days overdue | 6.0 | 8% | Sales head involved; hold new orders |
| 91–180 days overdue | 3.0 | 4% | Senior escalation; payment plan |
| Over 180 days | 6.0 | 7% | Legal notice or provision |
| Total | 80.0 | 100% |
Run the ageing by customer and by salesperson. Overdue amounts usually concentrate in a few accounts, and a few people's habits.
9. Cash flows, not profits
The problem: A big project needs approval and everyone is optimistic.
Count every cash flow the project changes, and nothing it doesn't.
By the end of the chapter you can:
- Build a project's incremental cash flows
- Treat working capital, tax and salvage correctly
- Avoid the common counting errors
What to include
| Include | Why | Plant 2 |
|---|---|---|
| Capital cost, including installation, trials and contingency | All cash needed to start | ₹120 cr |
| Operating cash flows after tax | The return on the investment | Contribution − fixed costs + savings |
| Tax saved by depreciation | Depreciation isn't cash, but it cuts tax | ₹9.3 cr a year × 25% |
| Working capital needed | Stock and receivables must be funded | 18% of revenue |
| Opportunity costs | Assets used that have another value | Not in Plant 2: the land is bought |
| Effects on other products | Cannibalisation or savings | Freight saving ₹3 cr a year |
| End value | Salvage of assets, recovery of working capital | ₹45 cr salvage in Year 10 |
10. Debt: loans, bonds, ratings
The problem: You must choose between debt, equity or giving cash back.
Debt is cheap because the company promises to pay on time; read every promise in the loan agreement before signing.
By the end of the chapter you can:
- Choose the right kind of debt for a need
- Read a term sheet and its covenants
- Calculate the ratios lenders use
What lenders look at
Lenders care about one thing: will they be repaid in full and on time? They answer it with a few ratios and a judgement about management.
| Measure | Formula | Comfortable level (typical) | Vardhan, Year 3 |
|---|---|---|---|
| Net debt to EBITDA | (Debt − cash) ÷ EBITDA | Below 2.5× | 0.38× |
| Interest cover | EBIT ÷ interest | Above 3× | 6.8× |
| Debt service coverage (DSCR) | Cash available ÷ (interest + principal) | Above 1.3× | 4.0× |
| Debt to equity | Debt ÷ shareholders' equity | Below 1.5× | 0.30× |
| Current ratio | Current assets ÷ current liabilities | Above 1.2× | 1.7× |
Cash available for debt service = EBITDA − tax. Levels are typical, not rules; each lender sets its own.
11. Find and screen targets
The problem: Your company is about to buy, merge with or sell to another.
The best deals usually come from a long list built to a clear set of criteria, not from whatever a banker brings in.
By the end of the chapter you can:
- Write clear acquisition criteria
- Screen a long list to a short list
- Make a first approach and start the process well
Acquisition criteria
Criteria agreed with the board before searching save time and reduce the risk of falling for a deal that doesn't fit.
| Criterion | Vardhan's version |
|---|---|
| Strategic fit | Cookware or kitchen products, sold through dealers |
| Region | South India first |
| Size | Revenue ₹100–300 crore; enterprise value up to ₹250 crore |
| Profitability | EBITDA margin above 8%, or a clear path to it |
| Ownership | Promoter or family-owned, willing to help with a handover |
| Deal-breakers | Large legal disputes, environmental liabilities, heavy debt |
Review the criteria once a year, alongside the strategy and the funding plan.
This article is adapted from the book. Examples marked “Example” use invented names and numbers; company stories are based on public sources listed in the book. Education only: not investment, tax or legal advice.


