NPV says how much value a project adds; IRR says what return it earns; payback says how long the money is at risk. Use all three, but decide on NPV.
Payback and discounted payback
Payback is the time until the cumulative cash flow turns positive: how long before the company gets its money back. It is easy to understand and popular in Indian boardrooms.
| Plant 2 (₹ crore) | Cash flow | Cumulative | Present value at 12.5% | Cumulative PV |
|---|---|---|---|---|
| Year 0 | −120.0 | −120.0 | −120.0 | −120.0 |
| Year 2 | 13.0 | −115.7 | 10.3 | −117.4 |
| Year 4 | 35.8 | −52.6 | 22.4 | −75.9 |
| Year 5 | 38.8 | −13.7 | 21.5 | −54.4 |
| Year 6 | 39.4 | +25.6 | 19.4 | −34.9 |
| Year 8 | 40.5 | +106.0 | 15.8 | −1.7 |
| Year 9 | 41.0 | +147.0 | 14.2 | +12.5 |
Net present value
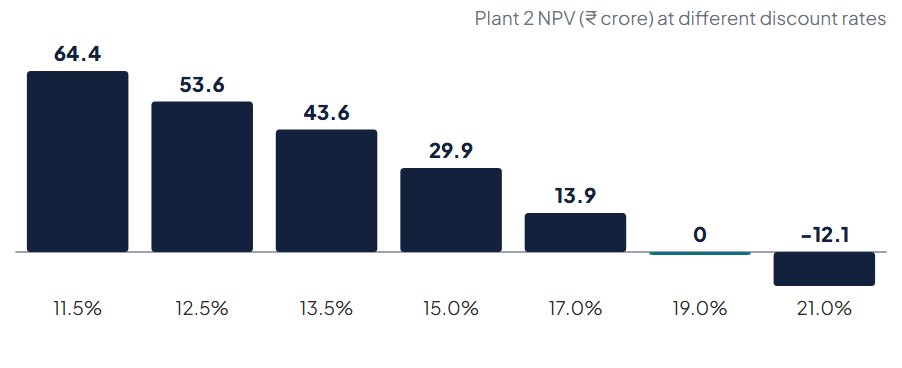
Net present value (NPV) adds up all the project's cash flows, each discounted to today at the cost of capital. A positive NPV means the project earns more than investors require; the NPV is the value it adds.
| Plant 2, discount rate | 11.5% | 12.5% | 13.5% | 15.0% |
|---|---|---|---|---|
| NPV (₹ crore) | 64.4 | 53.6 | 43.6 | 29.9 |
In Excel: =NPV(rate, Year 1:Year 10 cash flows) + Year 0 cash flow. NPV() assumes the first value is one year away, so add Year 0 separately.
Internal rate of return
The internal rate of return (IRR) is the discount rate at which NPV is exactly zero: the project's own rate of return. If it exceeds the cost of capital, NPV is positive.
| Plant 2 | Value |
|---|---|
| IRR | 19.0% |
| Cost of capital (WACC) | 12.5% |
| Spread | 6.5 points |
| Hurdle rate in Vardhan's policy | 15% |
When NPV and IRR disagree
| Problem | What happens | What to do |
|---|---|---|
| Different sizes | A ₹5 crore project with 40% IRR vs a ₹100 crore project with 20% IRR | Choose by NPV: the bigger project may add far more value |
| Different timing | Quick returns vs late, larger ones | NPV at the right rate |
| Cash flows that change sign twice | Big outflows late (e.g. mine closure): more than one IRR | Use NPV |
| Reinvestment assumption | IRR assumes cash is reinvested at the IRR itself | Use NPV, or a modified IRR (MIRR) |
The profitability index
The profitability index (PI) divides the present value of future cash flows by the initial investment: how much value each rupee invested produces. It is most useful when capital is limited (Chapter 7).
| Measure | Plant 2 | Answers | Weakness |
|---|---|---|---|
| Payback | 5.3 years | How long is our money at risk? | Ignores later years and timing |
| Discounted payback | 8.1 years | As above, with timing | Ignores later years |
| NPV | ₹53.6 cr | How much value does it add? | Depends on the discount rate |
| IRR | 19.0% | What return does it earn? | Misleads on size and odd cash flows |
| PI | 1.45 | Value per rupee invested | Ignores size |
Questions from the worksheet: NPV and IRR
Calculate the measures for your project at three discount rates.
Columns in the worksheet: Measure · Rate 1: ___% · Rate 2: ___% · Rate 3: ___% · Comment
What to remember
- Payback measures time at risk; it ignores later years and timing.
- NPV measures value added in rupees and is the decision rule.
- IRR and the profitability index help explain and rank, but follow NPV when they disagree.
- NPV
- Sum of discounted cash flows, including the investment.
- IRR
- The discount rate at which NPV is zero.
- Profitability index
- Present value of inflows ÷ investment.
This article is adapted from the book. Examples marked “Example” use invented names and numbers; company stories are based on public sources listed in the book. Education only: not investment, tax or legal advice.