
Each section names the problem, the idea in one line, what you will be able to do, and the method from the book.
1. Shares, indices, Nifty and Sensex
The problem: You trade on an app but don't know what happens after you tap Buy.
A share is a small piece of a business. An index is a basket of shares that tells you how a part of the market moved. Neither tells you what to buy.
By the end of the chapter you can:
- Explain what a share gives you, and what it does not
- Work out a company's market value and its weight in an index
- Use an index as a yardstick, not as a tip
Market value and free float
A company's market value (market capitalisation) is its share price multiplied by the number of shares. It is what the market as a whole says the company is worth at that moment.
| Group (common labels) | Rough meaning |
|---|---|
| Large-cap | The 100 biggest listed companies by market value |
| Mid-cap | The next 150 (101st to 250th) |
| Small-cap | Everything smaller (251st onwards) |
2. Line, bar and candle charts
The problem: A chart looks like red and green bars and nothing more.
The same prices can be drawn three ways. Each shows a different amount of the story. Candles show the most, which is why this Shelf uses them.
By the end of the chapter you can:
- Choose the right chart type for a question
- Read the same day on all three chart types
- Set up a chart that does not trick your eye
The bar chart: four prices
A bar chart (often called an OHLC chart) draws each day as a vertical line from the low to the high, with a small tick to the left for the open and to the right for the close.
| Part of the bar | Shows |
|---|---|
| Top of the line | The day's high |
| Bottom of the line | The day's low |
| Tick on the left | The opening price |
| Tick on the right | The closing price |
3. Support and resistance
The problem: You buy what has “fallen enough” and it keeps falling.
Support is a price area where falls have stopped before; resistance is where rises have stopped. They work because people remember prices and leave orders there.
By the end of the chapter you can:
- Explain why levels form
- Find support and resistance on a chart
- Use levels as places to decide, not as promises
Round numbers and old highs
Some levels form before price has ever touched them, because people anchor on them.
| Kind of level | Why it matters | Example |
|---|---|---|
| Round numbers | People place orders at ₹100, ₹500, ₹1,000, and index levels like 20,000 | A share stalls at ₹500 three times |
| All-time and 52-week highs | Every past buyer is in profit above it; many watch for a break | A share near its 52-week high |
| Previous swing highs and lows | The most recent places where the crowd turned | The last higher low in an uptrend |
| Big gap edges | Prices skipped on news (Book 2, Chapter 6) | The top of a gap down |
| IPO or offer prices | Many holders anchor to what they paid | Issue price of a recent IPO |
4. Reversal patterns
The problem: You know pattern names but not which ones to trust.
Reversal patterns show a trend failing to make progress, then giving way. They are complete only when the neckline breaks; until then the trend is still in charge.
By the end of the chapter you can:
- Recognise double tops, double bottoms and head-and-shoulders patterns
- Locate the neckline and the trigger
- Use reversal patterns to protect gains
Reading a double top properly
Not every pair of similar highs is a double top. Look for the details that show buyers weakening.
| Detail | Stronger pattern | Weaker pattern |
|---|---|---|
| Time between peaks | Several weeks | A few days |
| Second peak volume | Lower than the first | Higher than the first |
| Second peak candle | Upper shadows, shooting stars (Book 2) | Strong closes near highs |
| Neckline break | Decisive close on rising volume | A wick that recovers |
5. Moving averages
The problem: Your chart is buried under indicators that disagree.
A moving average is the most useful indicator for most traders because its job is simple: show the trend's direction and smooth out noise. Its weakness is equally simple: it is late.
By the end of the chapter you can:
- Calculate simple and exponential averages
- Read price against an average
- Explain why crossovers fail in choppy markets
Exponential moving averages
An exponential moving average (EMA) gives more weight to recent closes, so it reacts faster. Each day it moves a fixed fraction of the way from yesterday's EMA towards today's close.
| SMA | EMA | |
|---|---|---|
| Weights | Equal | Heavier on recent closes |
| Reaction to a turn | Slower | Faster |
| False signals in chop | Fewer | More |
| Drop-off effect | Yes | Much smaller |
6. Volume with trends and breakouts
The problem: Prices move and you can't tell who is behind the move.
Healthy uptrends rise on heavier volume and pull back on lighter volume. Breakouts are more believable on high volume. Climaxes, with extreme volume, often mark the end of a move.
By the end of the chapter you can:
- Judge a trend's health with volume
- Use relative volume to score breakouts
- Recognise a volume climax
Volume on breakouts
A breakout means new demand has overwhelmed old supply (Book 4). That usually shows up as high relative volume on the breakout day and the day after.
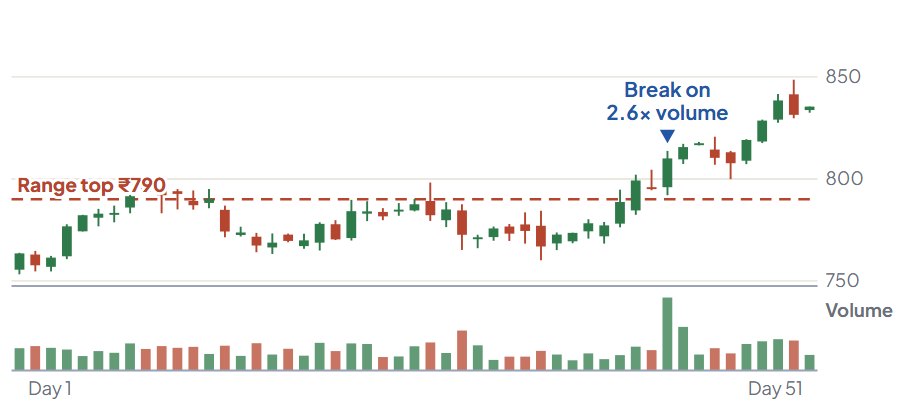
| Breakout volume | Reading |
|---|---|
| Under 1× | Unconvincing; many fail (Book 4, Chapter 5) |
| 1.5–3× | Convincing |
| Over 3× on news | Strong; check whether the news really changes the business |
7. Risk per trade: the 1% idea
The problem: One bad trade wipes out months of careful gains.
Choose in advance how much of your account you are willing to lose on any one trade, if your exit is hit. For most individual traders, about 1% (or less while learning) is a sensible ceiling.
By the end of the chapter you can:
- Separate position value from risk
- Set a risk per trade and a total open-risk limit
- Adjust risk as the account changes
The 1% idea
A widely used rule: risk no more than 1% of your trading account on any single trade. Some professionals use less; very few careful individuals use more than 2%.
| Account | 1% risk | 0.5% risk | 2% risk |
|---|---|---|---|
| ₹2,00,000 | ₹2,000 | ₹1,000 | ₹4,000 |
| ₹5,00,000 | ₹5,000 | ₹2,500 | ₹10,000 |
| ₹10,00,000 | ₹10,000 | ₹5,000 | ₹20,000 |
| ₹25,00,000 | ₹25,000 | ₹12,500 | ₹50,000 |
8. Futures
The problem: F&O looks like a small stake for a big payoff.
A futures contract moves almost one-for-one with its underlying. You deposit a margin, and every day gains and losses are settled in cash. The leverage is built in.
By the end of the chapter you can:
- Work out a futures contract's value and margin
- Follow daily mark-to-market
- Size a futures position with Book 7's rules
Lots and contract value
Futures trade in fixed lots: a set number of shares (or index units) per contract. Exchanges set lot sizes so that each contract is worth at least a minimum value, and revise them from time to time.
| Move in Indus Motors | Gain or loss on one contract |
|---|---|
| +1% (₹10) | +₹5,000 |
| −3% (₹30) | −₹15,000 |
| −10% (₹100) | −₹50,000 |
9. Fear and greed
The problem: You break your own rules when real money is at stake.
Fear and greed are not character flaws; they are normal reactions to risk and reward. The skill is recognising them in your body and thoughts early, before they make decisions for you.
By the end of the chapter you can:
- Recognise the physical and mental signs of fear and greed
- Notice the checking habit
- Use a simple pause before any unplanned action
What happens in your body
Money on the line triggers the same stress responses as physical danger: a faster heart, tight chest, narrow focus and an urge to act now. Gains trigger the reward system the way other exciting wins do. Neither state is good for careful decisions.
| Sign | Fear often feels like | Greed often feels like |
|---|---|---|
| Body | Tight chest, fast heartbeat, shallow breathing | Excitement, restlessness, can't sit still |
| Attention | Glued to the falling price | Glued to the rising price and to bigger targets |
| Thoughts | ‘Get me out’, ‘it will go to zero’ | ‘Add more’, ‘this is the big one’ |
| Urge | Sell now, at any price | Buy more now, before it runs away |
10. Write a rule anyone could follow
The problem: You trade rules you have never tested.
A testable rule is so precise that two people applying it to the same chart would take the same trades. Vague words like ‘strong’ or ‘looks good’ must become numbers.
By the end of the chapter you can:
- Write a rule with five precise parts
- Turn vague words into numbers
- Keep rules simple enough to test
From vague to precise
11. Pump-and-dump
The problem: A tip, a group or an app could cost you your savings.
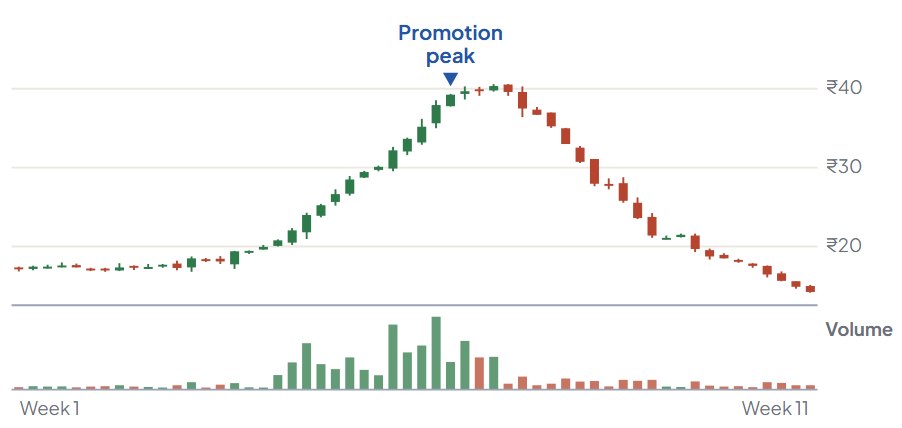
In a pump-and-dump, people connected to a scheme push up a thinly traded share, promote it to the public, and sell to the buyers they attract. When the selling ends, the price collapses.
By the end of the chapter you can:
- Describe the stages of a pump-and-dump
- Recognise its chart and message pattern
- Check a recommended small share before buying
What it looks like on a chart
| Chart sign | Why it matters |
|---|---|
| Steep rise with no company news | Demand coming from somewhere other than the business |
| Volume many times normal in a thin share | New buyers arriving, often from promotion |
| Repeated upper circuits | Small supply, eager buyers; exits will be just as hard |
| High volume with little progress at the top | Distribution: sellers meeting the crowd (Book 6) |
This article is adapted from the book. Examples marked “Example” use invented names and numbers; company stories are based on public sources listed in the book. Education only: not investment, tax or legal advice.

